In order to produce a report after creating a Garnet.rpt document, a Report Viewer control on a form is
needed. The preview of the Main Report shows how the
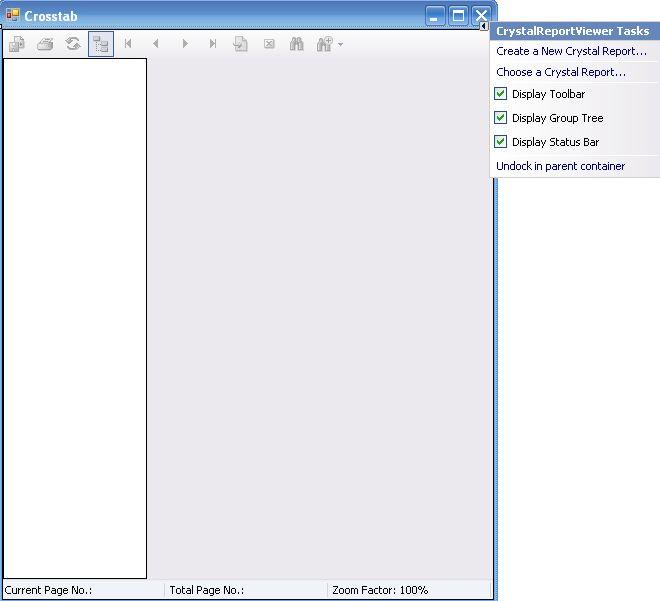
report would display in its final form. In order to display the report on a
form in the windows application, you will need to add a form to the project and
then drag and drop a CrystalReportViewer control on
to the form as shown in Figure 25. The Crystal ReportViewer occupies the whole
form, as shown with several of the icons grayed out. These will become active
once the CrystalReportViewer is configured to show
the report by establishing the relationship between these two objects in the
IDE.
Configuring the CrystalReportViewer is facilitated by the
.NET feature called the smart tasks, in this case the CrystalReportViewer
Tasks.
CrystalReportViewerTasks shows the various tasks that need
to be performed. Obviously, the first choice would take you through the
necessary steps of creating a New Crystal Report. In this tutorial this has
already been accomplished. The second item, Choose a Crystal Report…, would
help you in choosing an existing Crystal Report that can be viewed on this
viewer.
Figure 25
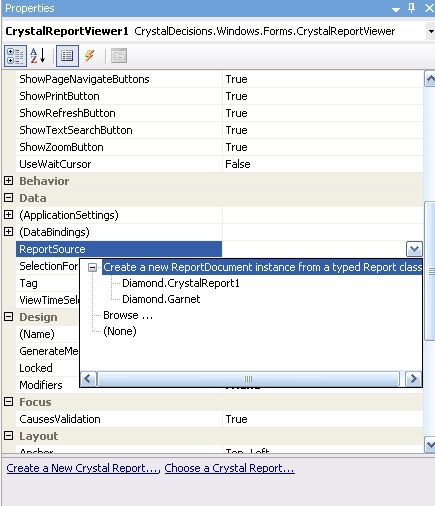
When you access the CrystalReportViewer's
properties window by right clicking it, you will be able to make changes to
various items. This includes the choice of choosing a CrystalReport
from among the various reports that may exist (as shown in Figure 26) where the
Diamond.Garnet report will be chosen. You may also
browse for other reports that may be residing in the machine as well.
Figure 26
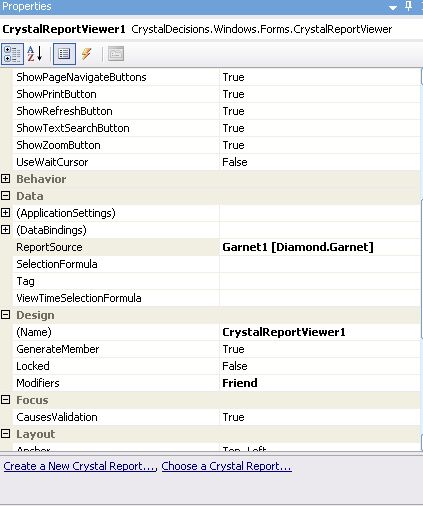
When you make the above choice, the properties pages get the
binding to the report created earlier. In addition to adding the CrystalReport
to the CrystalReportViewer you may make many other choices as well. The key
elements of the CrystalReportViewerTasks also appear at the bottom of the
CrystalReportViewer properties.
Figure 27
By associating the Diamond.Garnet [ProjectName.ReportName] report source with the
CrystalReportViewer1, the binding is automatically established as shown in the
Code behind the CrossTab.Designer.vb a part of which
is reproduced in Listing 2.
Listing 2
Private Sub InitializeComponent ()
        Me.CrystalReportViewer1 = New Crystal Decisions. _
        Windows.Forms.CrystalReportViewer
        Me.Garnet1 = New Diamond.Garnet
        Me.SuspendLayout ()
        'CrystalReportViewer1
        Me.CrystalReportViewer1.ActiveViewIndex = 0
        Me.CrystalReportViewer1.BorderStyle = System.Windows.Forms. _
        BorderStyle.FixedSingle
        Me.CrystalReportViewer1.Dock = System.Windows.Forms.DockStyle.Fill
        Me.CrystalReportViewer1.Location = New System.Drawing.Point (0, 0)
        Me.CrystalReportViewer1.Name = "CrystalReportViewer1"
        Me.CrystalReportViewer1.ReportSource = Me.Garnet1
        Me.CrystalReportViewer1.Size = New System.Drawing.Size (419, 497)
        Me.CrystalReportViewer1.TabIndex = 0
        'Crosstab
        Me.AutoScaleDimensions = New System.Drawing.SizeF (6.0!, 13.0!)
        Me.AutoScaleMode = System.Windows.Forms.AutoScaleMode.Font
        Me.ClientSize = New System.Drawing.Size (419, 497)
        Me.Controls.Add (Me.CrystalReportViewer1)
        Me.Name = "Crosstab"
        Me.Text = "Crosstab"
        Me.ResumeLayout (False)
    End Sub
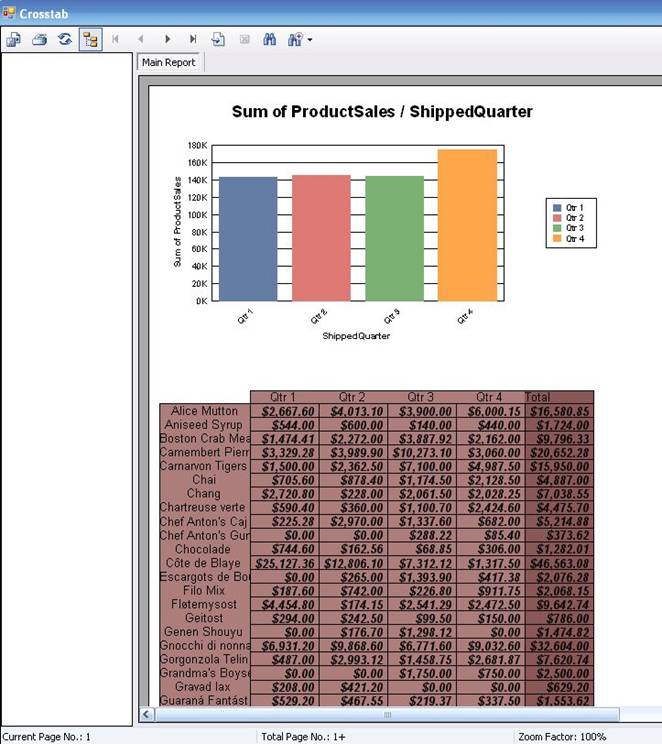
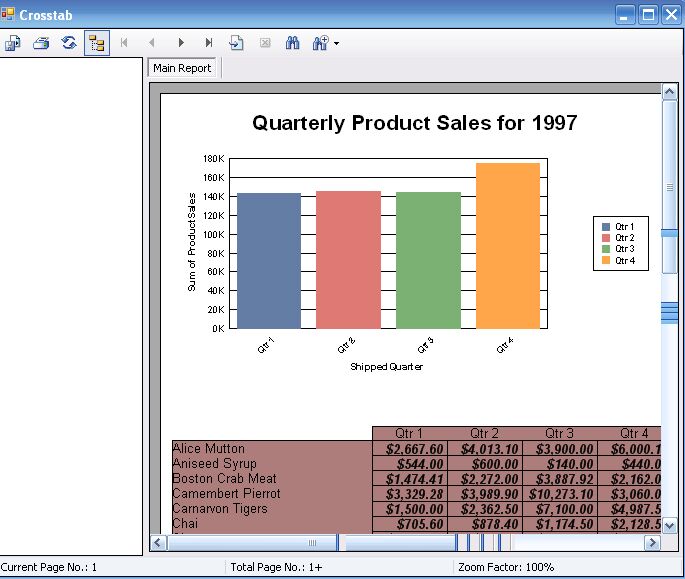
The report is now ready for prime time. Just build the
project and make sure that the Crosstab is the Startup
form and run. You should be able to see the report now hosted on the Crosstab
form as shown in Figure 28. You may also notice that the information has
exceeded the limits of a page spread to a second page. You may use the
navigation buttons at the top to go to the next page and once in the next page
to come back. The various icons in the report menu are now active for
printing, zooming, searching, etc.
Figure 28
All elements on the design area are configurable. Figure 29
shows how the Row#1 Name object can be formatted by
clicking the object which brings up a context sensitive menu from which you can
accomplish your task. This will bring up the Format Editor
window as shown in Figure 30. For example, by choosing the Graph1 object the
title can be changed.
Figure 29
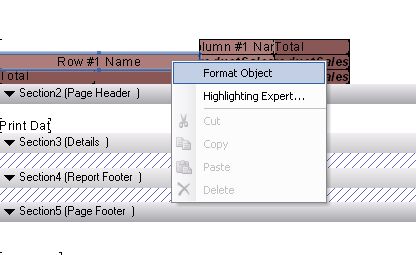
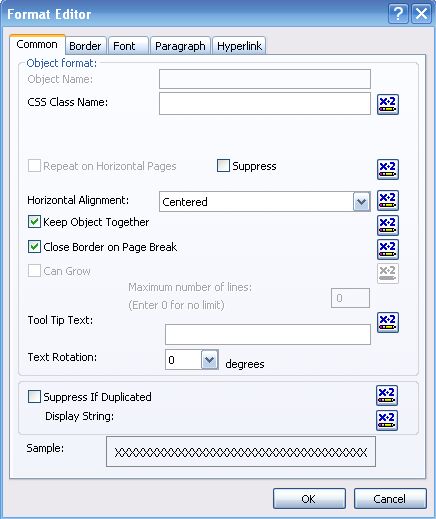
When you choose the Format Object
in the drop-down, you will be invoking the Format Editor
shown in Figure 30. The editor comes with the defaults and, as shown in Figure
30, the row elements are centered. This was changed to "Left" as
shown in Figure 30. Now when the report is open, the rows will be aligned to
the left.
Figure 30
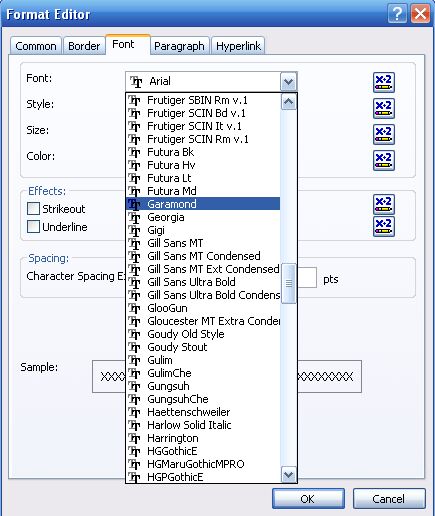
Similarly the font was changed from the default of
"Arial" to "Garamond," as shown in Figure 31.
Figure 31
It is possible to modify the formatting of all objects from
their default values using the design interface. When you are sufficiently
satisfied, you rebuild the projects and run to display the form. This is the
completed cross-tab report of the data from the Northwind database.
Figure 31