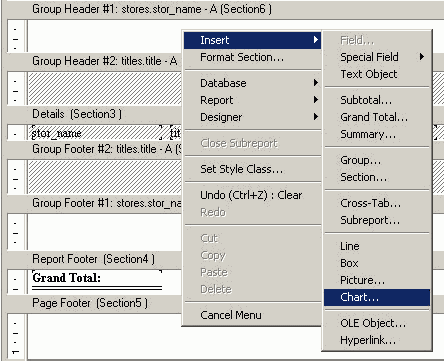
Insert a new chart into the Group 1 Header to represent the Book Titles.
Right click within the Group 1 Header area, select Insert and then select Chart.

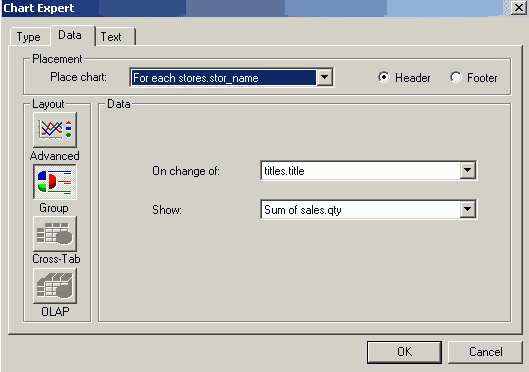
From the pop-up window, select Bar graph from the Type tab, and set the Placement option on the Data tab to For each Stores.stor_name so that the chart is plotted depending on the Store.

- Hide Group 1 Header initially, to allow viewing the details only thru Drill down
Right click on the Group 1 Header Panel, select Hide (Drill Down OK)