AspAlliance.com LogoASPAlliance: Articles, reviews, and samples for .NET Developers
URL:
http://aspalliance.com/articleViewer.aspx?aId=217&pId=-1
Creating Professional Reports using Crystal Report for Visual Studio.NET (Part 3)
page
by Eric Landes
Feedback
Average Rating: This article has not yet been rated.
Views (Total / Last 10 Days): 26885/ 46

Introduction

Editor's Note: The first edition of this article was written by Ajay Varghese.

In this last part of the series, we will take a look at how conditional formatting can help us hide/display a section of the report.  Conditional formatting refers to those formatting that are triggered only when certain condition is satisfied.  Note that these formatting will override any fixed formatting done earlier using the Format Editor.

For our current requirement, the Group 1 Footer (Store Details) should be visible only when the Store details are being displayed, and should be hidden while displaying the Book Details.  In other words, we need to get rid of the dangling parent row.  To achieve this, we will take an approach of assigning a value to a variable in the higher level section (Report Header) and displaying the details depending on the value of the variable in the lower level sections. The following steps can be used to implement this :

Create and Modify Formula

1. Create a new formula field as explained in the previous part, and type in the below shown code into the Formula Editor window (Note that we are using Crystal Syntax here to assign a value 1 to the variable RH).
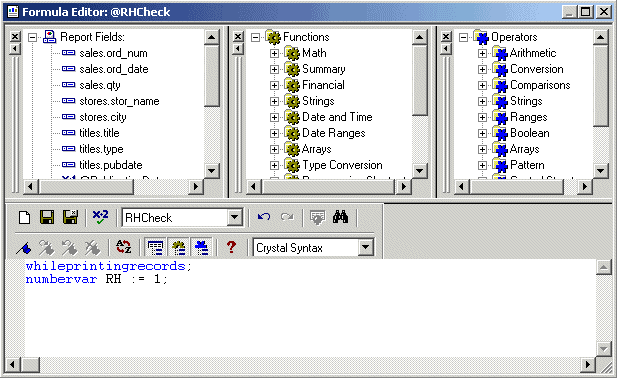
2. Drag and drop the formula on to the Report Header section

3. Hide the formula field so that it doesn’t appear on the report. This can be achieved by right-clicking on the formula field (on the report), select Format, select the Common tab, and check the option Suppress.

4. Right click on the Group 1 Footer panel, select Format Section. This should bring up the Section Expert window.
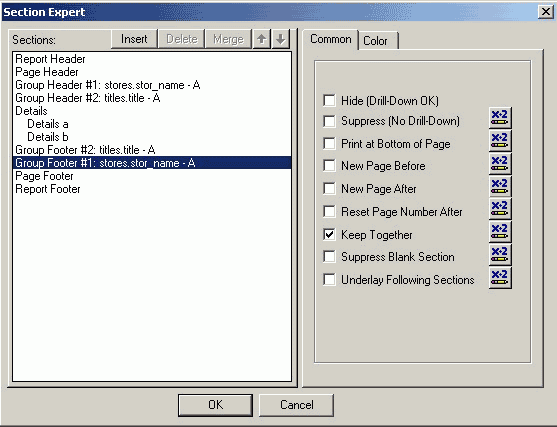
5. Click on the x-2 symbol, next to the Suppress (No Drill Down) checkbox and type in the code shown below into the formula editor window. Here, we check for the value of the variable to decide if the details should be displayed or not.
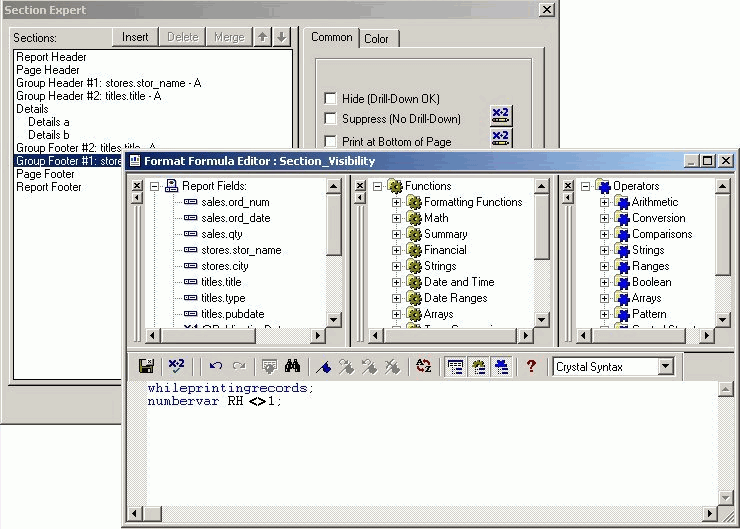
Note that you will have to repeat the above steps (with a different variable) to make sure that the Footer 2 (Book Details) does not get displayed while viewing the Order details.

Improving Report Presentation

Now view the report in a browser and you will notice that we have got the same functionality as that of the report that we saw at the beginning of this walkthrough.

To improve the presentation of the report, you can get rid of the default headings that were generated by the wizard and instead use a Text Object to represent the headings and format it with various effects.

Crystal Report provides a number of options to choose from while formatting a Chart. I leave it to you to select a combination that suits your taste.  To get to the Chart Format Editor, right click on the Chart, select Format Chart, and then select General.

Click here to see how the report should look like in a browser

As the Stores table in the PUBS database doesn’t contain multiple orders for the same Store and Title combination, you will find only a single row every time on the Order details report.  If you try inserting some records directly to the table, you would notice that we still have a problem of the Order heading being repeated for each Order detail row.  This can be easily fixed by right clicking on the Order heading, selecting Format, and checking the Suppress if duplicated option.

Additional Formatting

You could also include some additional formatting like marking the quantity red when it is below a certain value and marking it green when it is above a certain value. This can be achieved by right clicking of the Quantity field on the report, selecting Format, selecting the Font tab, clicking on the x-2 symbol next to Color, and specifying a condition like :

If {Sales.Qty} > 50 Then
   crGreen
Else If {Sales.Qty} < 50 Then
   crRed
Else

   crBlack

Different reports would have different requirements. Reports without any Groups or with just one Group could be much simpler. As the number of Groups increase, the report creation could get more complicated. The important thing to remember here is that using a combination of the Header and Footer, Formulas and Conditional Formatting will give you total control over designing the report to your specific requirement.

Conclusion

That brings us to the end of this walkthrough and we hope you enjoyed reading it.  You are most welcome to send us your suggestion/feedback.  We would try to respond to any clarifications sent to us. Due to time constraint if we are not able to get in touch with you personally then we suggest that you sign up with some of the mailing lists/discussion groups where the experts hang out. Personally, we find these two groups most helpful. They have categories that covers any topic related to .NET .


Submitted by

Ajay Varghese & Shankar N.S

Sr. Software Engineers

Jarvis Infotech

< < Part 2


Product Spotlight
Product Spotlight 

©Copyright 1998-2024 ASPAlliance.com  |  Page Processed at 2024-04-20 1:23:42 AM  AspAlliance Recent Articles RSS Feed
About ASPAlliance | Newsgroups | Advertise | Authors | Email Lists | Feedback | Link To Us | Privacy | Search