Visualization options for ASP.NET Charts
Complete solutions for visualization and charting for .NET and ASP.NET including
interactive and custom mapping (works with industry standard shape files).
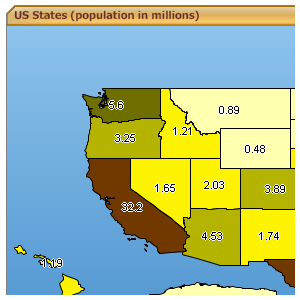
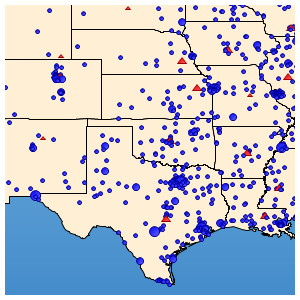
Interactive and custom mapping
charts enable you to click for more information, click to highlight or identify
locations and popup custom data bound annotations.
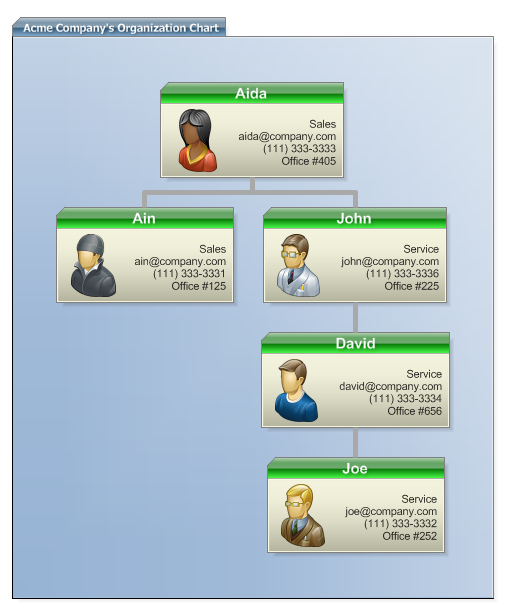
Organizational charts
also known as org charts, support interactive features and support for AJAX zooming
and scrolling.
Gauge and dial charts
are supported in the base package and provide easy at a glance information for KPI
and dashboard implementations.
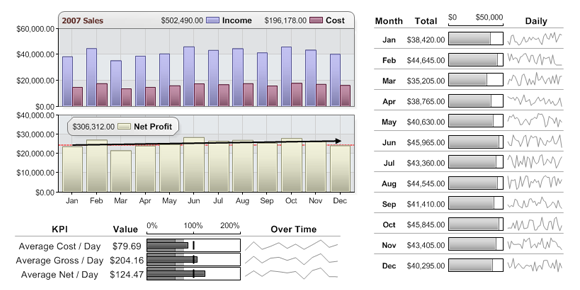
Now digital dashboards including microcharts and sparklines are in common use. The
images below highlight some visualization options, you can also see more
dashboard chart examples.
To learn more about the interactive functionality see the
AJAX and chart interactivity demonstrations.