Add a crystal report template to a project
Highlight the windows project and right click to pick Add, New Item…as shown in Figure 3.
Figure 3
<img border=0 width=297 height=413 src="/ArticleFiles/1041/image003.jpg">
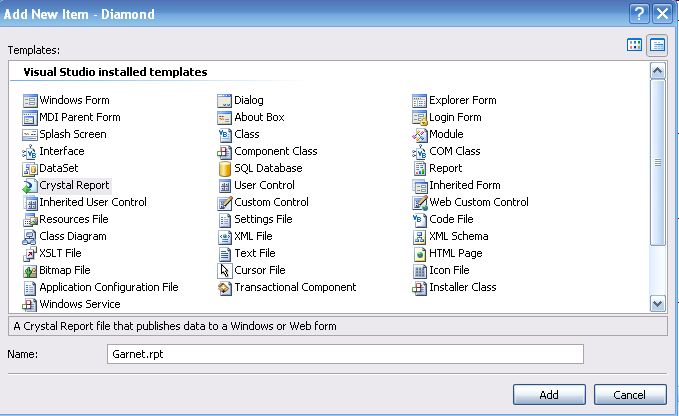
This opens up the Add New Item
window where you click on the Crystal Report template from a list of Visual Studio Installed templates as shown in Figure 4. It
adds a default Crystal Report, Crystal Report1, if this is the first report in
the project. This may be changed to something different. This name of the
report created for this tutorial is Garnet.rpt.
Figure 4
Report Wizard Steps
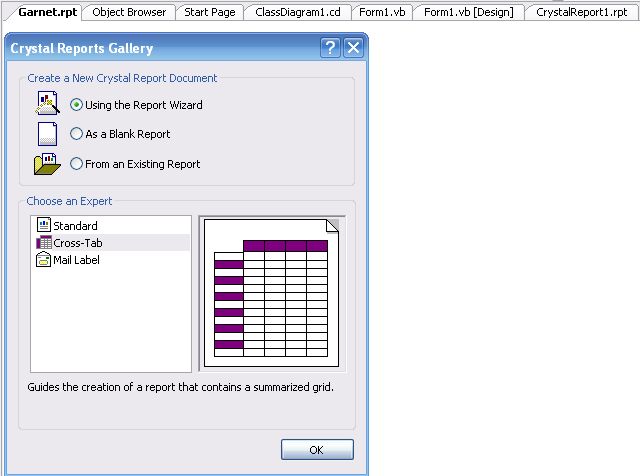
As soon as you click the button Add
in Figure 4, a Garnet.rpt file is added to the
project and a Crystal Report Gallery window appears
in the design view of the Garnet.rpt as shown in Figure 5.
You may use this window to create a new crystal report document
by three different means. If you use the wizard, you can further choose an
expert to create three different kinds of reports. However, when you choose the
option, As a Blank Report, you will be starting from
scratch. In this tutorial the choice made is to use the Report
Wizard and the Cross-Tab expert to create a
cross-tab report. You can see the outline of a cross-tab grid with rows,
columns, and cells in the Crystal Reports Gallery
window.
Figure 5
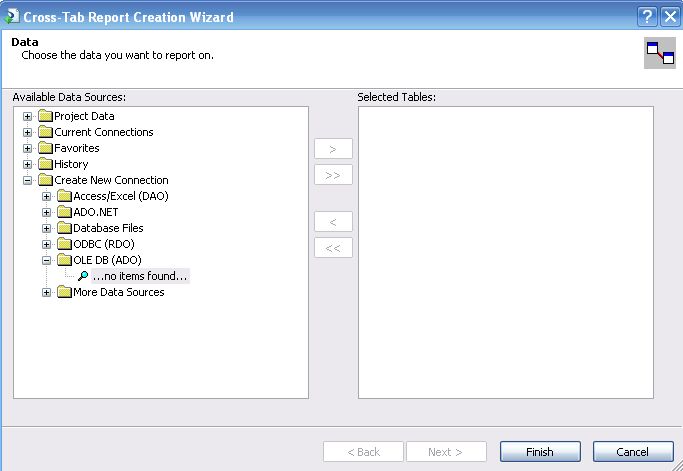
When you click on the button OK,
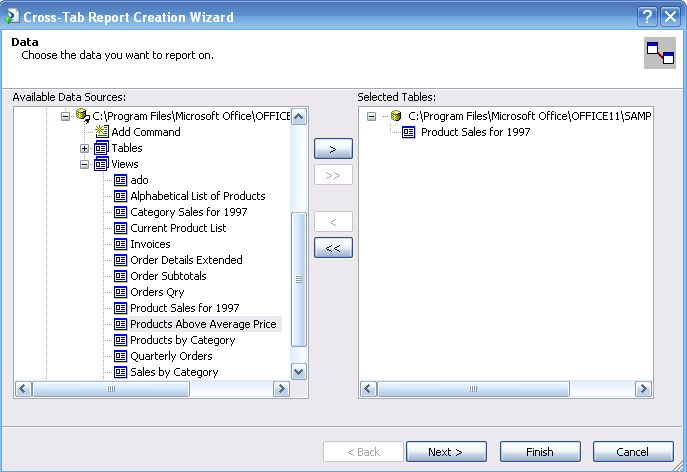
you open up the next window, Cross-Tab Report Creation
Wizard. This is an important step in the report creation process. You
need to choose the data which may be saved in any of the several containers
listed in the left half of Figure 6 in the Available Data
Sources area. Since this tutorial will create a new connection to a
data source, the Create a New Connection node is
expanded to look for the source of Northwind data. The OLE DB (ADO) sub-node,
where such data could be found, is empty. Another obvious container for Access
data (DAO) is also available. Since Access 2003 uses ADO extensively, the OLE
DB is used.
Figure 6
Double click the OLE DB (ADO) node to open up the next
window, OLE DB (ADO). This provides an extensive
list of data providers which also lists the Microsoft Jet 4.0 OLE DB Provider.
Figure 7
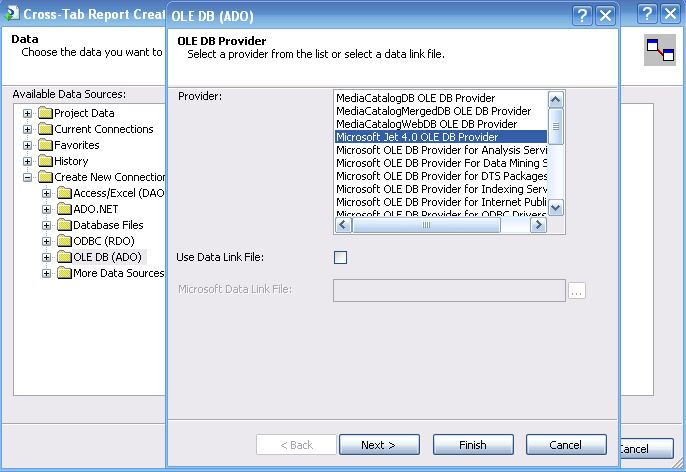
Highlight the Microsoft Jet 4.0 OLE DB Provider and click on
the Next button. This opens the window shown in
Figure 8. In this window you must provide the connection information to the
data source. When it is opened the database type and UserID field are
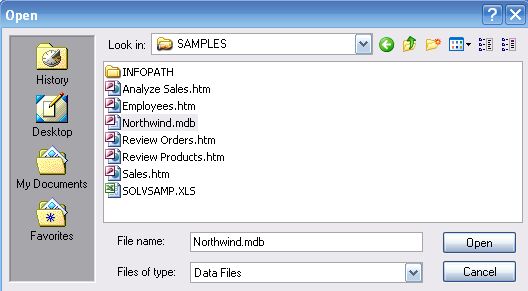
automatically added. You can click on the ellipsis button (…)
across the Database Name item to open the file
directory on your machine. You then navigate to access the file required as
shown in Figure 9. When you choose the file and click open, the Databse Name field gets filled up.
Figure 8
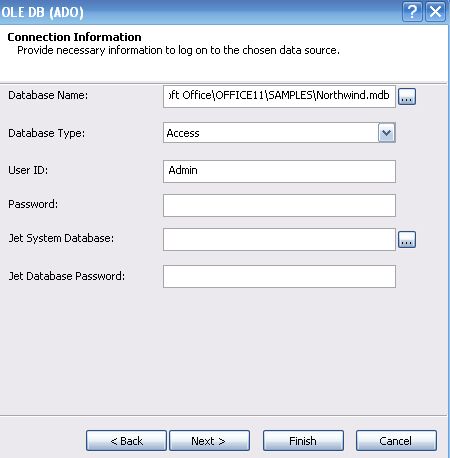
Figure 9
Click on the button Next in Figure 8 to open the next window
shown in Figure 10. Here you may carry out modifications if necessary. Here
no changes were made.
Figure 10
<img border=0 width=452 height=463 src="/ArticleFiles/1041/image010.jpg">
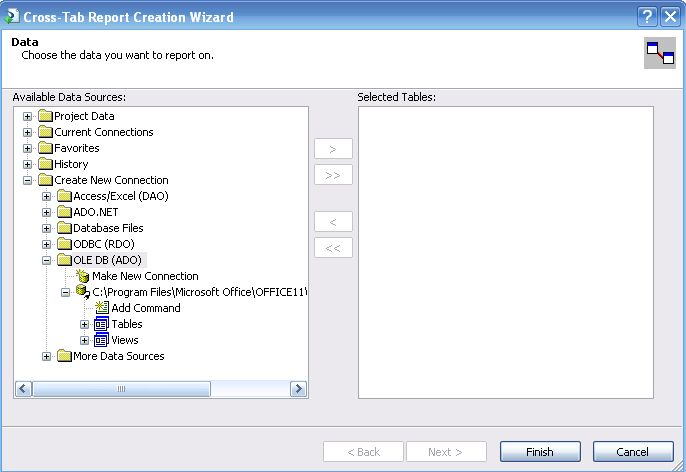
Now click on the Finish button
which takes you to the next step of the wizard. Here you have established the
connection to the Northwind.mdb file which shows all the Tables
and Views contained in it. In addition to the Tables and Views you can also set
up a command using the Add Command shortcut. The
queries in MS Access 2003 are represented as Views in this window.
Figure 11
Click on the node, Views. This
expands the node as shown in Figure 12. Here you see the query, Product Sales for 1997.
Figure 12
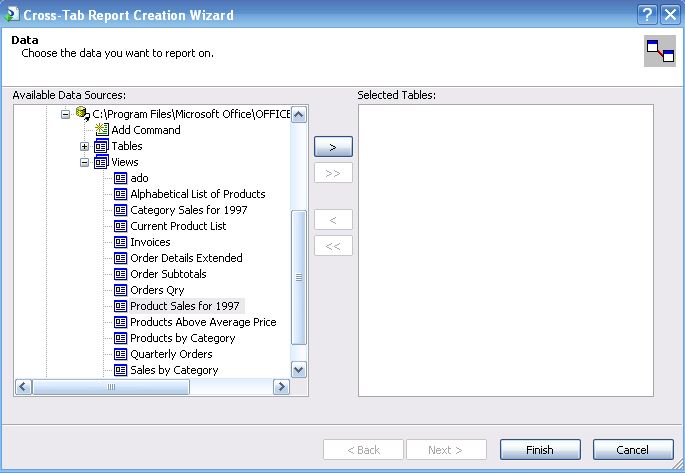
Highlight the Product Sales for 1997
in the Views node and click on the > (transfer to
right) button in the middle. This transfers the selected view to the right.
Figure 13
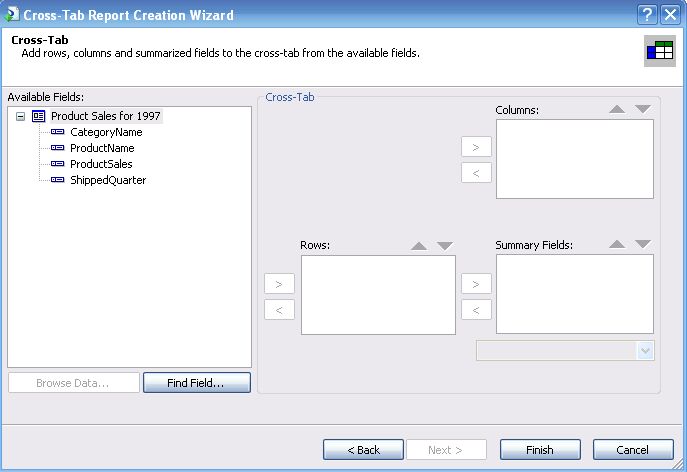
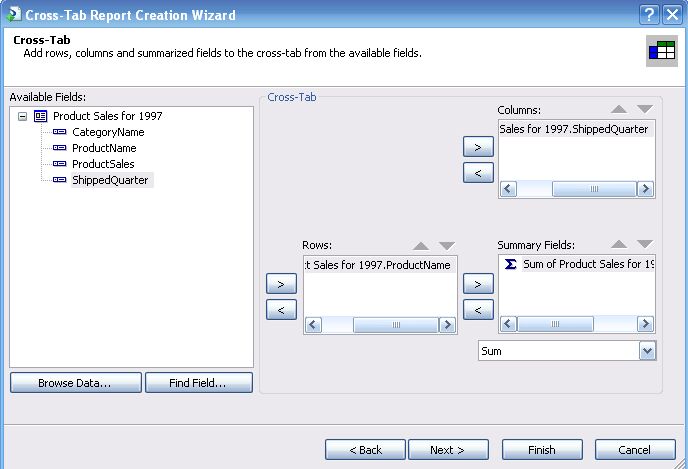
Now click on the Next button to
open the window, Cross-Tab Report Creation Wizard. This
is the Cross-Tab sub task that you must complete to generate the report. The Available Fields window shows the various fields in the
report which you may verify against Figure 2. This window is used to create
the rows, columns and the summary fields needed for the cross-tab report. It
will be helpful to recall the analogy of the expense report. This window may
also be used to verify what kind of data exists in each of these fields, since
we need to differentiate what is summarized information and what is not summarized
information. In this case it is obvious that Product Sales is the summarized
information.
Figure 14
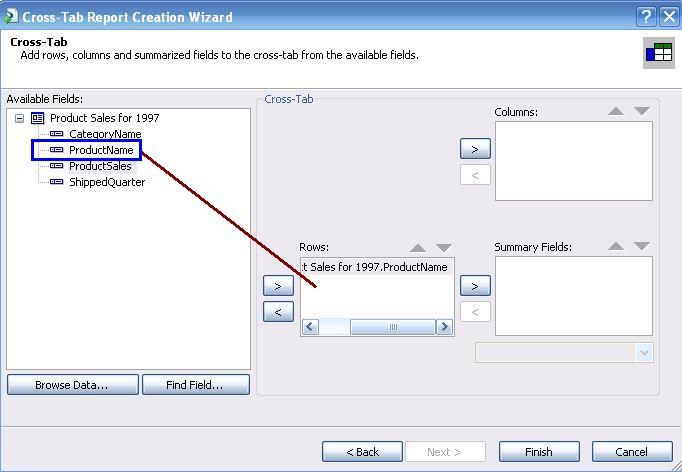
We want to show the product name as rows and should therefore
highlight ProductName in the available fields list
and click on the arrow > for selecting Rows as
shown in Figure 15. This will populate all the rows of the cross-tab report
with product names. You may also drag an item from the Available
Fields and drop it into any of the Rows, Columns, and Summarized Fields
window.
Figure 15
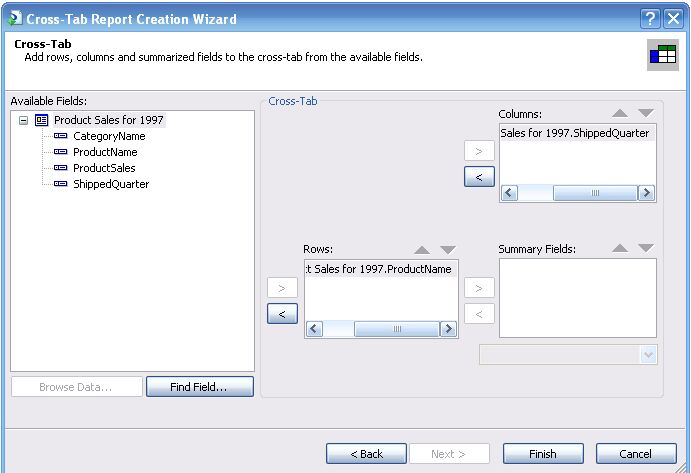
Similarly, highlight the ShippedQuarter
in the available fields and click on the > arrow in the Columns
related area in the Cross-Tab. This adds the ShippedQuarter
to the Columns of the cross-tab report.
Figure 16
Now highlight the ProductSales and click the > arrow in
the Cross-Tab in the summary fields area. This adds the ProductSales values to
this area as shown in Figure 17. When you see this sigma symbol you get the
first assurance that you are placing the correct type of information. Even if
you make a mistake in any of these manipulations nothing is lost. Everything
can be reset and reapplied until you get the result you expect. Most of the
items added can be removed by the < button. Also, most of the windows have
a button named Back which will take you to a previous
window.
Figure 17
For this tutorial you have made all the necessary choices
and should now click on the Finish button. This
takes you to the screen where you can make record selections. Although you
have already selected records when you chose the query, you make selections of
fields not included in the fields to be included in the report should you so
desire at this stage.
Figure 18
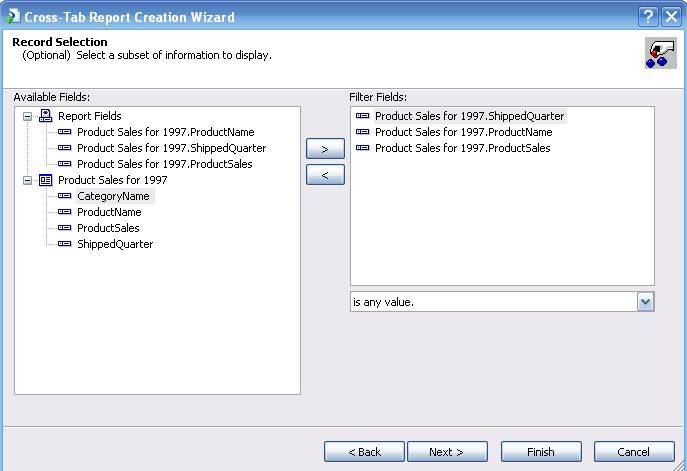
For this case, where all the fields are already chosen and
no extra fields are showing in the available fields' area, you can skip this
screen by clicking on the Next button. This figure
was included more for keeping the description of the wizard's steps complete. When
you click on the Next button, the window shown in
Figure 19 will open. This task is also optional. If you do require a chart to
be included with the report, you may choose the kind of chart in this screen. A
bar chart was chosen for this tutorial.
Figure 19
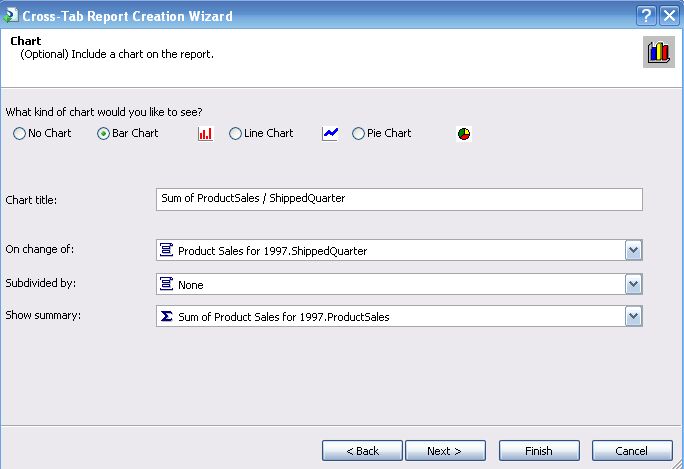
You may want to change the parameters in the drop-down and
show quantities of interest in the chart, the defaults were assumed for this
tutorial. When you click on the Next button, you
will come to the window shown in Figure 20 where you need to choose a style for
the cross-tab report from a list of pre-defined styles.
Figure 20
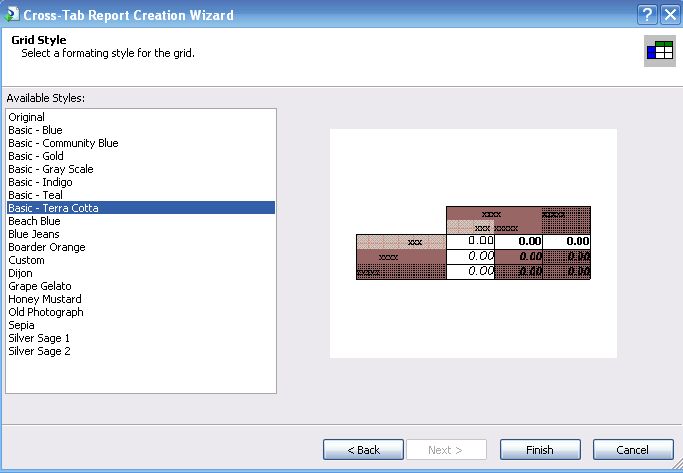
You can pick each of these styles and see how they are
rendered in the image area in the right. Basic - Terra Cotta style was chosen
for this report. You have come to the last step in the wizard. When you click
on the Finish button, you will be shown the Field Explorer
window shown in Figure 21 and the crystal report in the design view tab as
shown in Figure 22. Figure 21 is quite similar to the Field List (or Field
Explorer) from earlier versions of Crystal Reports. This explorer lists all
kinds of fields used in a report that includes database fields and non-database
fields, such as those that support printing.
Figure 21
The Garnet report has two tabs at the bottom, a Main Report in design and a MainReportPreview
tab which shows a preview of the data within the VS IDE. You can make design
changes and toggle the tabs to preview the report and back to make changes to
the design again.
Figure 22
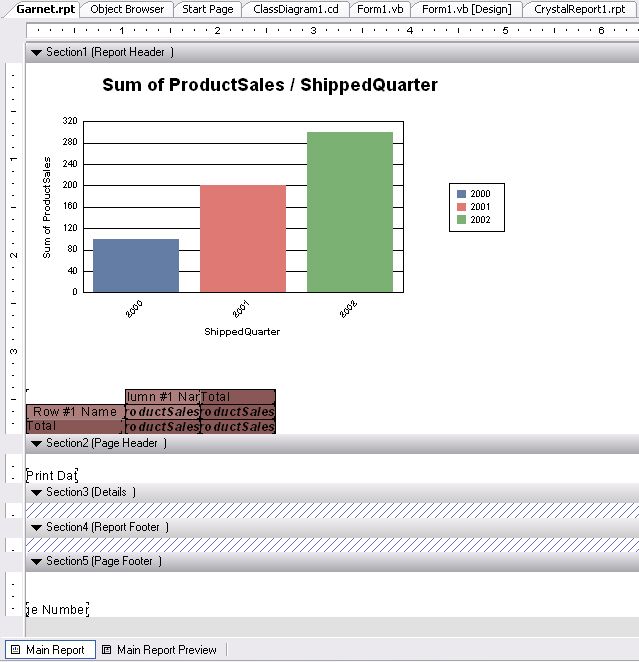
The "banded" structural details of Figure 22 are
similar to those from earlier versions of Crystal Reports. Both the chart and
the cross-tab grid are in Section 2, the Report Header.
There is also a field "Print Date from the
specified fields" node of the Field Explorer in
Section 5, the report footer. The horizontal axis showing shipped quarter has
year values, but this is just some representative features and has no relation
to the underlying data. Only when you hit the Main Report
Preview tab would you see the actual numbers from the underlying data.
Figure 23
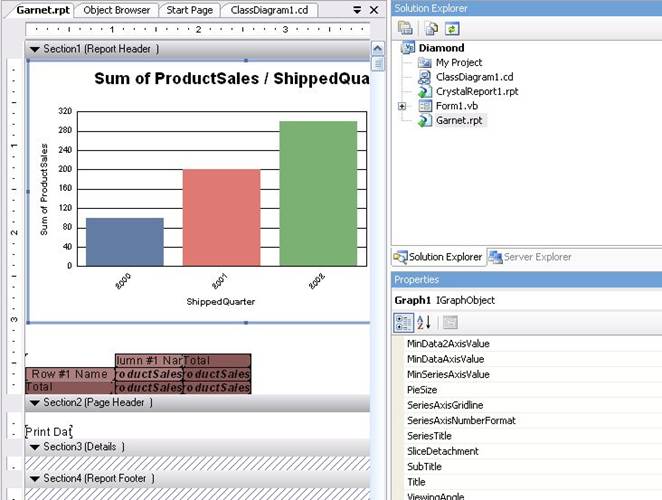
All objects on the different areas of the report and their
properties can be accessed from windows, such as the one showing in Figure 23
for the Graph 1 object. The object is surrounded by a thin blue outline and
the properties are available in the Graph 1 object's property window. For
example, the title of the graph (or chart) was changed to "Quarterly
product Sales for 1997" in this window.
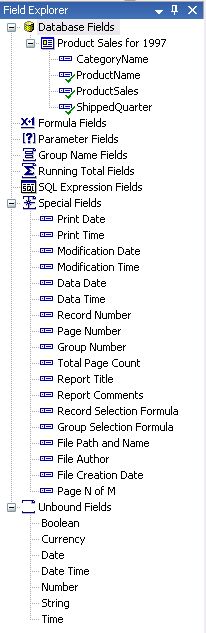
Figure 24 shows the fully expanded view showing all the
available fields for the developer. It includes the fields from the databse
used in the report. The Field Explorer and the Design view of the report are available for the designer at
the same time and the fields can be dragged and dropped on the Design view on
the appropriate sections. For example, the Print Date field was dropped into
the PageHeader by default.
Figure 24