Below is what the ReportViewer looks like in the ASP.NET designer when the control is not fully expanded.
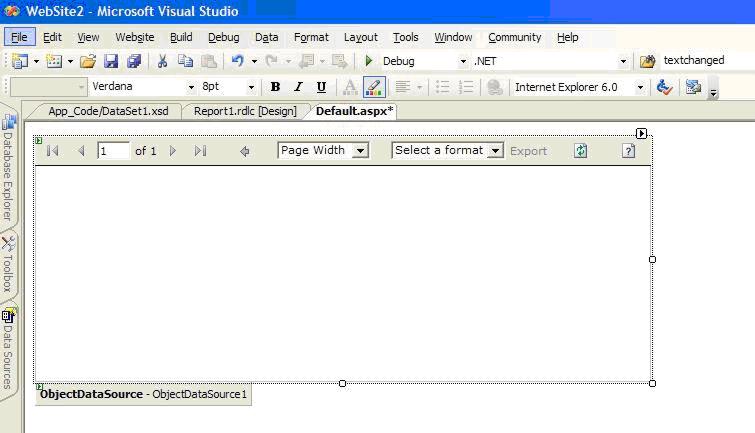
Figure 1 – The ASP.NET version of the ReportViewer control, in context.
On the upper right-hand side of the control, notice the small smart tag arrowhead pointing to the right. Clicking on this tag is a fast way to access the settings of the crucial properties needed to get the report running. Also note the Data Sources tab under the Toolbox tab on the left edge of the image.
The steps for creating and running a report in Local mode are as follows.
-
Create a new form and drag a ReportViewer control onto it.
-
Create a new Report (via the smart tag or by pressing Ctrl-Shift-A and selecting Report as the type of item to add).
-
Create a DataSource via the Data Sources tab's visual designer. This DataSource will be used by the report created in step 2.
-
Drag fields from the DataSource into the Header and Table cells of the new report.
-
Open the form created in step 1, and use the smart tag of the ReportViewer control to select the report which was created in step 2.
-
Now, since the default is Local versus Remote mode, we simply need to set our form as the startup form and run it.
If you want to run in Remote mode using reports published to SQL Server, set ProcessingMode to Remote via the dropdown list, and set the location of the report with a URL. See the pertinent properties in Figure 2 below.
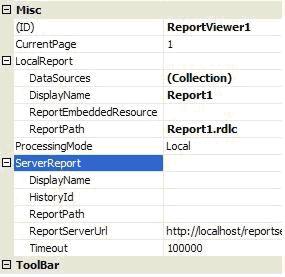
Figure 2 – Properties Relating to Local versus Remote Reporting
These reports have many advantages as discussed in an earlier article, Comparing HTML Reporting and MS SQL Server Reporting Services.
The six steps above can be completed in 60 seconds for a simple one-to-many table-based report that requires no code to be supplied by the developer. The new Reporting Services has become even more valuable to me as a reporting option.