One of the most common questions people wonder
when using ORM data frameworks is, "so what SQL code
is it running under the covers?" LINQ makes it easy to figure this out. Just set a debugging
breakpoint on a LINQ expression variable and you can use a built-in LINQ
debugging visualizer to inspect it while debugging.
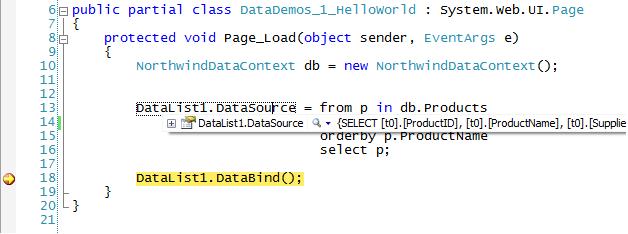
For example, set a breakpoint on the
DataList1.DataBind() method above and when it is hit,
hover your mouse over the DataList1.DataSource property and click the
magnifying glass to launch its DLINQ query visualizer.
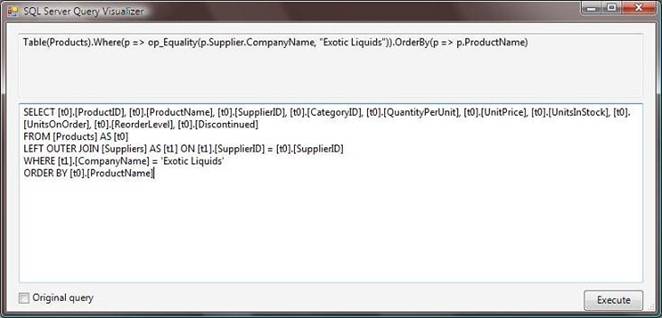
Figure 10
This will bring up a visualizer dialog that displays the SQL
statement that LINQ will execute against the database when evaluating that LINQ
expression.
Figure 11
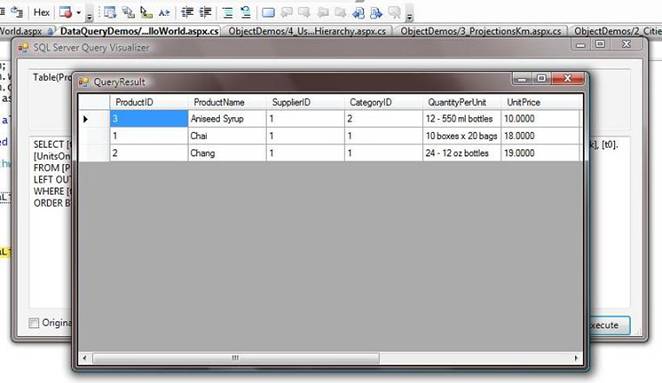
If you click the "execute" button on
the bottom-right you can even test out the query in the debugger and see the
exact data that will be returned from it when the supplier name is "Exotic
Liquids."
Figure 12
This makes it really easy to see the exact SQL that is
executed and closely watch what is going on as you modify and refine your LINQ
queries.