In order to access useful business intelligence from
enterprise data for comparison or trend analysis, data in the form of a list is
less useful. Cross-tab reports provide the support to extract data for
decision making. Cross-tab reports are based on cross-tab objects; objects
which are represented by a two dimensional grid that has data values based on a
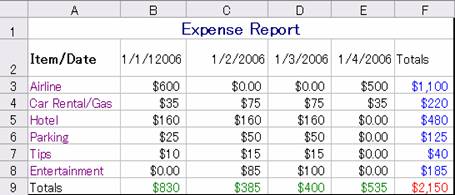
logic that you specify. Figure 1 shows an example of a cross-tab report from an
expense report of an employee. This report shows at a glance how much the
employee spent on what date in addition to the total the employee spent for the
trip. This is more useful than just a day-to-day listing of expenses.
Figure 1
Query used in the present tutorial
While the original data comes from tabulated values, the
reports are usually based on queries run against the database. This tutorial
uses a query run against the Northwind database. The Northwind database has
data related to products of various categories sold and shipped for several
years by a number of different shippers. Listing 1 shows the query run against
the sample database for obtaining sales made in 1997 shown in Figure 2. In
order to obtain this data a number of tables are joined.
Listing 1
SELECT Categories. CategoryName,
 Products.ProductName, Sum (CCur ([Order
 Details].UnitPrice*[Quantity]*(1-[Discount])/100)*100) AS ProductSales,
 "Qtr " & DatePart("q",[ShippedDate]) AS ShippedQuarter
FROM (Categories INNER JOIN Products ON
 Categories. CategoryID=Products.CategoryID) INNER JOIN (Orders INNER JOIN
 [Order Details] ON Orders.OrderID=[Order Details].OrderID) ON
 Products.ProductID=[Order Details].ProductID
WHERE (((Orders.ShippedDate) Between #1/1/1997# And #12/31/1997#))
GROUP BY Categories.CategoryName,
 Products.ProductName, "Qtr " &
 DatePart("q",[ShippedDate]);
Figure 2
<img border=0 width=528 height=470 src="/ArticleFiles/1041/image002.jpg">
While this data in the above format is correct and valid, it
is not very useful if you want to get a summarized view, such as the one we saw
in the expense report. In this tutorial the data will be used to create a
cross-tab report that will answer questions regarding quarterly sales, total
sales of 'Boston Crab Meat', etc.